Copolarized and Cross‐Polarized SAR Measurements for High‐Resolution Description of Major Hurricane Wind Structures: Application to Irma Category 5 Hurricane
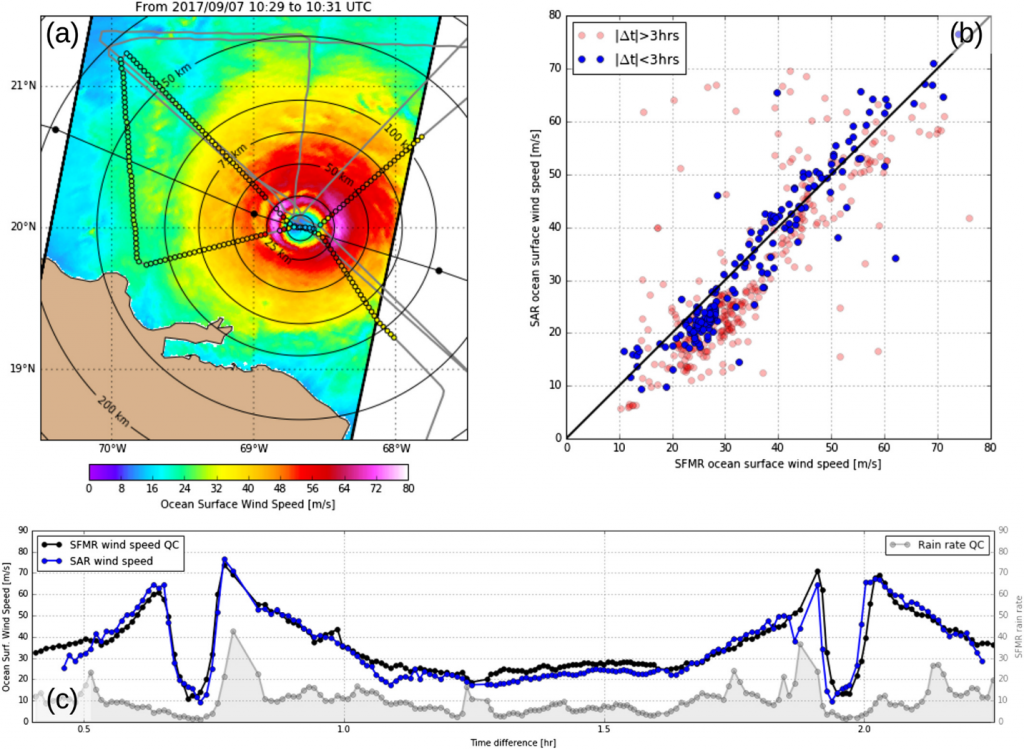
As part of the journal article published in the “Journal of Geophysical Research: Oceans”, Mouche et al 2019 confirms the potential to quantitatively interpret, at very high resolution, the sea surface imprints captured by spaceborne SAR measurements under extreme weather conditions. When coanalyzed with Stepped Frequency Microwave Radiometer wind estimates, the radar backscatter signals acquired in major hurricanes from Sentinel‐1 and Radarsat‐2 SAR reveal high sensitivity in the cross‐polarized channel for wind speeds up to 75 m/s. The combination of the two copolarized and cross‐polarized channels can then be used to derive high‐resolution surface wind estimates. The retrieval methods and impacts of intense rainfall are discussed in the context of a Hurricane Irma (2017) case study. On 7 September 2017, Sentinel‐1 measurements intercepted Hurricane Irma when it was at category 5 intensity. When compared to Stepped Frequency Microwave Radiometer, SAR‐derived wind speeds yield bias and root‐mean‐square of about 1.5 and 5.0 m/s, respectively. The retrieved wind structure parameters for the outer core are found to be in agreement with the Best‐Track and combined satellite‐ and aircraft‐based analyses. SAR measurements uniquely describe the inner core and provide independent measurements of the maximum wind speed and the radius of maximum wind. Near the radius of maximum wind a 65‐m/s increase in wind speed in less than 10 km is detected, corresponding to an instantaneous absolute vorticity of order 210 times the Coriolis parameter. Using a parametric Holland model and the environmental surface pressure (1,011 hPa), SAR‐derived wind speeds correspond to a central surface pressure of 918 hPa (921 hPa from the Best‐Track) in Irma’s eye.
The full reference of this study can be also found in Documentation section.